Apr 4, 2023
Hugo
David
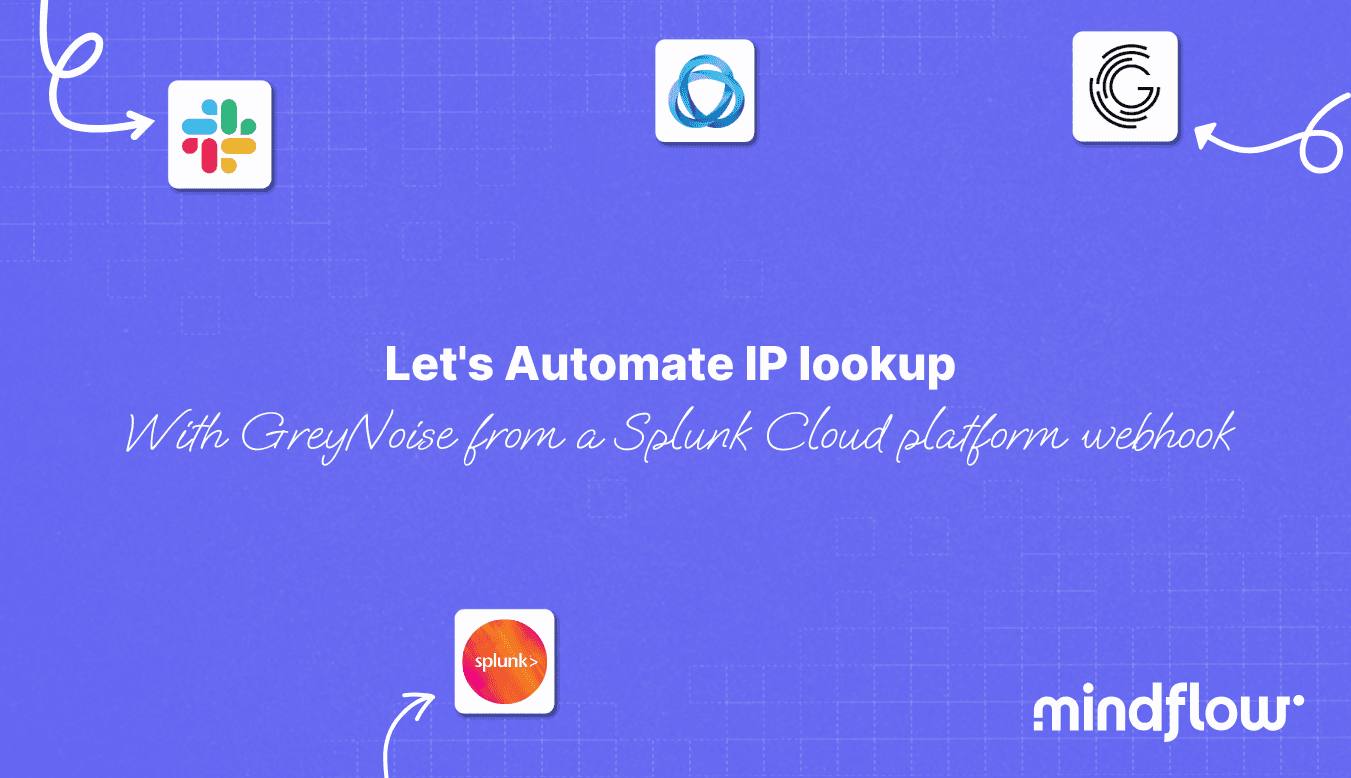
Today, we will learn how to automate IP lookup with GreyNoise using a Splunk Cloud Platform webhook alert.
With the constant evolution of the threat landscape, one must avoid cybercriminals' evolution, if not stay ahead. One way to achieve this is by automating the analysis of alerts generated by security tools like Splunk Cloud Platform. This Flow is designed to help security teams efficiently and effectively respond to potential threats by automating the analysis of IP addresses flagged in Splunk Cloud Platform webhooks alerts.
This playbook's importance lies in its ability to streamline the threat detection and response process. By automating the analysis of IP addresses flagged in Splunk Cloud Platform alerts, security teams can significantly reduce the time spent on manual investigation and focus on more strategic tasks.
Moreover, this playbook enables organizations to quickly identify and respond to malicious activities and understand if they are being specifically targeted or under a mass attack, which will dramatically change how they react to the incident. Ultimately, this playbook helps minimize the risk of data breaches and other security incidents.
The playbook works as follows: When an IP address triggers an alert in Splunk Cloud Platform due to a high number of scans on a specific port, the alert is redirected to the playbook via a webhook. The playbook then pushes the flagged IP address to GreyNoise, a third-party service that analyzes IP addresses to determine their maliciousness based on their behavior across the web.
Trigger, setting the Splunk Cloud Platform webhook alert with the detection rule
This section will discuss setting up an alert in Splunk Cloud Platform that will trigger a webhook action when a specific rule is met. This rule is designed to monitor the number of scans on a specified port and flag IP addresses that exceed a certain threshold.
To configure the alert, use the following example of a Splunk query:
To customize the query for your specific use case, follow these steps:
Replace
<your_index_name>with the name of the index where your data is stored.Replace
<your_sourcetype_name>with the name of the source type that your data is tagged with.Replace
<your_threshold_port_number>with the port number that you want to monitor.Replace
<your_threshold_scan_count>with the minimum number of scans that you want to trigger an alert.
This query will analyze the data in your specified index and sourcetype, counting the number of scans for each source IP and destination port combination. It will then filter the results only to display IP addresses that have scanned the specified port above the threshold scan count.
Once the query is set up, you must configure the alert to trigger a webhook action. To do this, follow these steps:
In the Splunk Cloud Platform, navigate" to the" "Alerts" section and create a new alert.
Set the alert condition using the customized query provided above.
Configure the alert to trigger a webhook action when the specified condition is met. To do this, provide the webhook URL that will receive the alert generated by the playbook. Copy and paste this URL into the field needed in Splunk.
By configuring the alert and the Splunk Cloud Platform webhook action, the playbook will automatically receive the alert data when the specified rule is met.
Splunk Cloud Platform webhook introspection and data extraction
In this section, we will discuss the process of webhook introspection and extracting relevant data from the Splunk Cloud Platform webhook. The playbook will use this data to analyze the flagged IP addresses further and take appropriate action.
A typical Splunk webhook payload will be structured as follows:
To extract the relevant information from the webhook payload, we will use the native data transform tool that will allow us to parse the payload and extract the necessary data, such as the flagged IP address and the number of port scans that triggered the alert. For example, you can use a parsing function to extract the IP address and port number "rom t"e "event" field:
ip_address = extract_ip_from_event(webhook_payload['event'])port_number = extract_port_from_event(webhook_payload['event'])
Additionally, you can extract the alert severity, description, source, and timestamp for further analysis or reporting purposes:
We will utilize the flagged IP address and other relevant information to perform a more in-depth analysis using third-party services like GreyNoise by extracting this data.
IP lookup with GreyNoise
In this section, we will perform an IP lookup with GreyNoise on the flagged IP address and determine the appropriate response actions baseIP's the IP's behavior.
IP lookup with GreyNoise: To analyze the IP address, push it to GreyNoise using a GNQL (GreyNoise Query Language) query. Based on its observed behavior across the web, GreyNoise will classify the IP as either benign or malicious.
Response Actions: Depending on the classification of the IP address by GreyNoise, follow the appropriate response actions:
Benign Actor: No further action is required if GreyNoise classifies the IP address as benign.
Malicious Actor: If GreyNoise classifies the IP address as malicious, perform the following steps:
Push this IP address to your WAF solution to update the ruleset: We use AWS WAF to update the IP ruleset with this malicious IP address.
Assess the risk and check if the IP was flagged with other behaviors: If the IP has been seen elsewhere and reported performing other malicious behaviors, extract these behaviors under t"e fie"d “tags.”
Create a Jira ticket: Gather the collected information from the IP lookup with GreyNoise and the Splunk Cloud Platform webhook (IP address, port scans, other behaviors), and assign the rank HIGH PRIORITY if the IP has been reported with other malicious behaviors. If the IP has not been reported with other behaviors or has been reported as performing mass scans, create a Jira ticket with the collected information and assign the rank LOW PRIORITY.
Notify the Security Team: Once the appropriate response actions have been taken, notify the Security team in Slack about the created Jira ticket by linking its URL and priority rank. This will ensure that the Security team is informed of potential threats and can take necessary actions to mitigate the risks.
Enrichment with third-party threat intelligence services
If the IP has been flagged somewhere else, performing scans or making specific requests, or if this IP has only been flagged performing scans on your port, this could indicate a targeted, if not advanced, attack against your networks and system. Now, it's a race against time to gather as much information as possible about this IP: all the behaviors linked to it and its close IP address, ASN location, Threat actors associated with it, their modus operandi to gain access to your network and systems, in other words, the kill chain they are known to operate with, and known IOCs (Indicators of Compromise).
This is why, in this section, we will discuss additional steps that can be taken in this workflow to gather more comprehensive threat intelligence using specialized services like RiskIQ (now Microsoft Defender Threat Intelligence) or other similar platforms that will be able to provide in-depth information on specific threat actors, infrastructure, and other malicious activities RiskIQ's API to gather information related to the flagged IP address or threat actor name, for instance. You can use API endpoints to gather more intelligence: /host, /search/advanced, /intelligence/group or /campaign, and /group/group_id/indicators or /campaign/campaign_id/indicators.
This may include, but is not limited to:
Details about the threat actor associated with the IP address
Information on associated domains and infrastructure
Historical malicious activities linked to the IP address
Geolocation data and ASN (Autonomous System Number) information
Associated IOCs
With the additional threat intelligence data, update the Jira ticket to include the new findings depending on the action you queried. As we saw above, the information collected may involve adding more context about the threat actor, their tactics, techniques, and procedures (TTPs), and any other relevant information that can help the Security team better understand and prioritize the threat.
Additionally, notify the Security team on Slack to warn them of a high-priority event and link the updated Jira ticket to ensure that the Security team is well-informed of the latest information and has all the cards in hand to take every necessary action.
Incorporating additional threat intelligence services like RiskIQ or similar platforms into the workflow can significantly enhance an organization's ability to understand and respond to potential threats. By gathering more specialized intelligence on threat actors, infrastructure, and malicious activities, security teams can make more informed decisions and prioritize their response efforts accordingly.